Trusted Data & Market Insights for NYC Real Estate Professionals and their Consumers
In New York City every building is its own market. UrbanDigs offers local analytics, personalized reports, and relevant insights to power meaningful conversations centered around the specific needs of your clients to grow your business.
14 day free trial
No credit card required
As seen in


A better way to price properties.
You can quickly find and adjust the most suitable sales to match your property to create tailor-made pricing strategies for your listing presentations or buyers. The tools offer you full control over several dimensions for each comparable sale you use to reach a better price appraisal for your target unit.
CMA REPORTS
Start the pricing conversation right
CMA REPORTS
Start the pricing conversation right
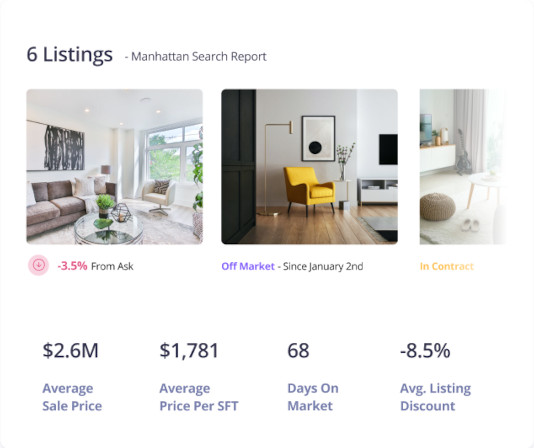
Create effective neighborhood Comparable Market Analysis reports, complete with local area statistics for active, in contract and closed in Manhattan and Brooklyn listings.
COMPS REPORTS
Create tailor-made pricing strategies
Quickly find and adjust the most suitable sales to match your target unit. Use our automatic adjustments or take full control of several dimensions specific to NYC real estate to create tailor-made pricing strategies.
COMPS REPORTS
Create tailor-made pricing strategies

Download a sample of our weekly report, which contains insightful and timely highlights for the sales and rental market, along with accurate and actionable information.
DownloadData Driven Market Insights
Stop second guessing what the market is doing. See the full picture for Manhattan or Brooklyn real estate, powered by the best, most accurate data on the market.
CHARTS REPORTS
Track New York’s real estate market trends.

CHARTS REPORTS
Track New York’s real estate market trends.
From Listing Discount to Monthly Contract Activity and Price Per Square Foot (ppsf) trends, real estate professionals rely on our customizable and brandable charting system to track the most critical New York City real estate trends
Other powerful features
Branded Infographics
Choose your design, Customize & Engage your clients in a whole new way!
Building Sales & Trends
Track coop, condo, and townhouse sales prices and negotiability trends.
Collaboration & Alerts
Powerful and timely client communications is key in this business. Be the trusted expert your clients demand with our real-time, actionable insights. Stay on top of the competion with daily alerts.
Track Listings
Add listings into your watchlist to track daily price reductions and status changes
Save Searches
Save and share searches for all your clients and receive daily new listing alerts
Invite your Clients
Share your searches, listings, reports and chats with all of your clients in one place
Daily Alerts
Enjoy daily alerts up to 3x a day for saved searches & listings.
14 day free trial, no credit card required
Weekly Podcasts & Videos
Between the popular TalkingManhattan podcast and our Weekly ‘in the trenches’ videos, we make sure you know what's going on in the NYC real estate markets as they happen.